P
K

CloudWatch managed syslog ingestion, tested end to end
AWS now takes syslog straight into CloudWatch Logs over PrivateLink — no agent, no collector to run. I set it up in one region and pushed real firewall and lab switch logs through it to see what the managed parser actually gives you.
·
7 min read
·
AWS
Palo Alto Networks
Log Forwarding
Firewall Operations
What it actually does
Managed syslog ingestion lets network devices, appliances and Linux hosts send syslog straight into CloudWatch Logs without an agent or a self-hosted collector. Sources send over TCP, TCP+TLS or UDP to a VPC endpoint in your account, and the traffic is tunnelled through AWS PrivateLink to the CloudWatch Logs syslog service, which parses each message and extracts structured fields such as facility, severity, hostname and application name. Sources already inside your VPC talk to the endpoint directly; on-premise sources reach it over the VPN or Direct Connect link you already run.
The appeal, if you already live in AWS, is that there is nothing new to operate. No collector to size, patch or keep highly available — that job moves to AWS. It suited me as a way to onboard logs quickly for a look, without provisioning anything.
Where it lives
Everything hangs off one interface VPC endpoint for the com.amazonaws.<region>.syslog-logs service. You create it the same way as any other interface endpoint, in the VPC that your devices can already reach.
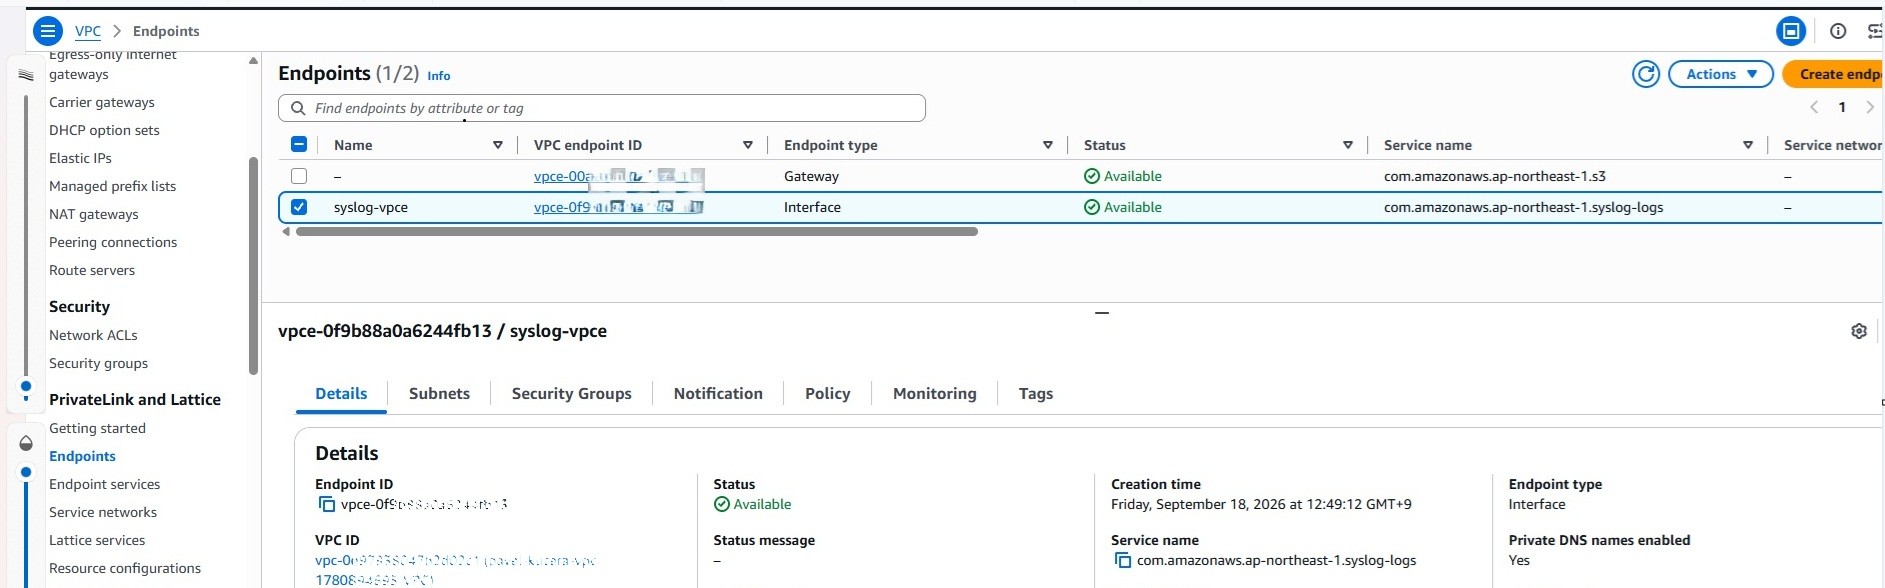
The syslog interface endpoint alongside the account's existing endpoints — service com.amazonaws.ap-northeast-1.syslog-logs, state Available.
The endpoint gets an elastic network interface in each subnet you select, so placing it in two subnets across Availability Zones gives you AZ-level resilience from a single endpoint — you do not create one per zone. Devices then send to the endpoint's DNS name, or to an ENI private IP, both shown on the endpoint's Details tab.
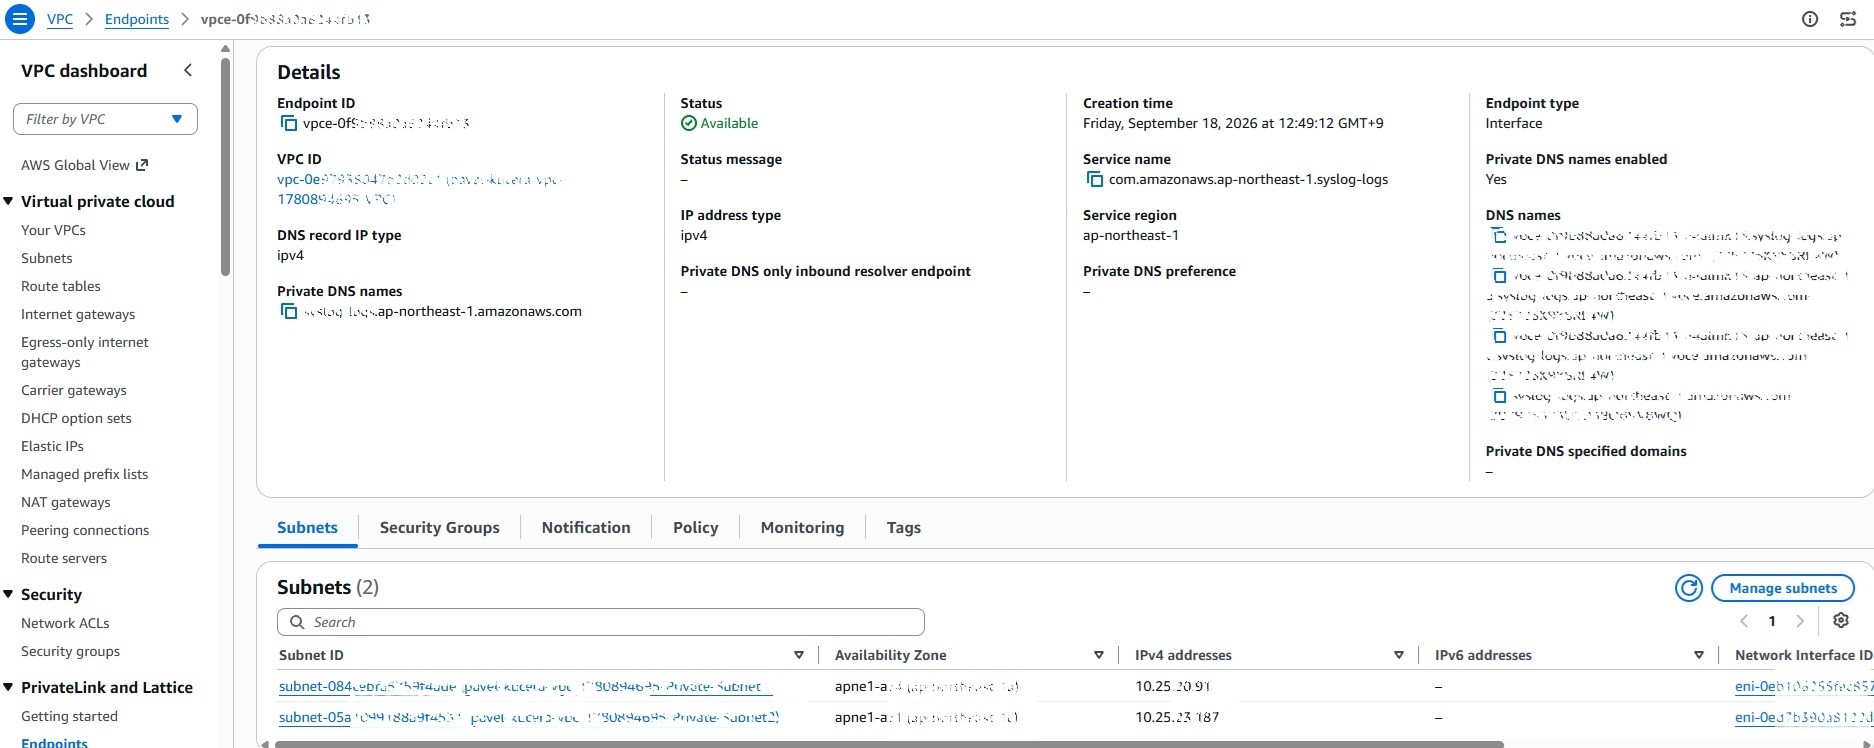
Endpoint detail: the DNS names devices send to, and the two subnets (one per Availability Zone) that carry the ENIs.
Transport and ports
Three transports are offered, on fixed ports. There is no option to change them, so plan your security-group and on-premise firewall rules around these three.
Transport | Port | Notes |
|---|---|---|
TCP + TLS | 6514 | Encrypted in transit. Recommended where compliance requires it. |
TCP plaintext | 1514 | Unencrypted but isolated on PrivateLink. Delivery acknowledgement and retransmission. |
UDP | 514 | Best-effort delivery; messages can be dropped with no feedback. |
TLS on port 6514 is terminated at the network load balancer using an AWS-managed certificate issued by Amazon Trust Services, so your clients trust it automatically with no extra configuration. Plain TCP on 1514 is unencrypted but isolated on PrivateLink, and it still gives you delivery acknowledgement and retransmission; UDP on 514 is best-effort. Messages are capped at 64 KB over TCP and 8 KB over UDP — comfortably above a normal syslog line.
Setting it up
The AWS side is four moving parts, in order: a VPC endpoint, a log group, a resource policy that authorises the syslog service, and a syslog configuration that binds the endpoint to the log group. Customers with an existing VPC and connectivity can start at the endpoint. The official guide has the click-by-click; what follows is the shape of it and the one step that catches people out.
The log group is an ordinary CloudWatch Logs group. Once it exists, its detail page carries a Syslog ingestion section where you associate the VPC endpoint.
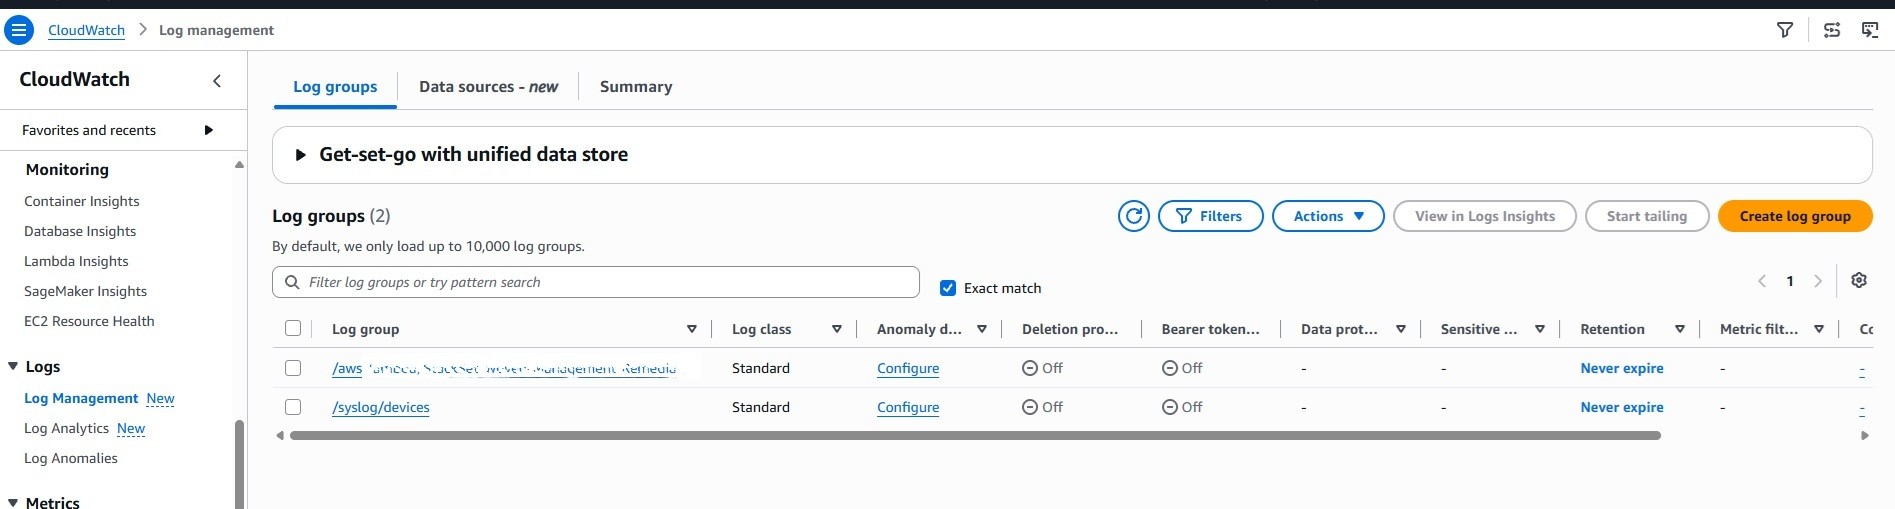
The target log group, /syslog/devices, in CloudWatch Log management.
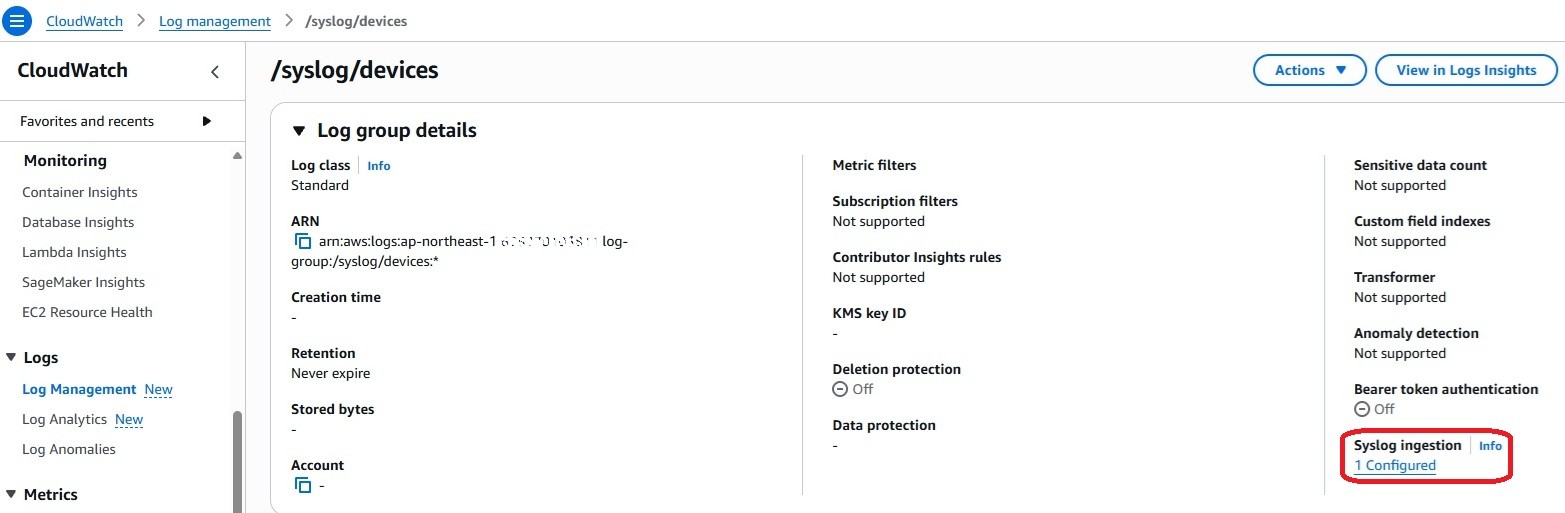
The log group's detail page, with Syslog ingestion showing one endpoint configured.
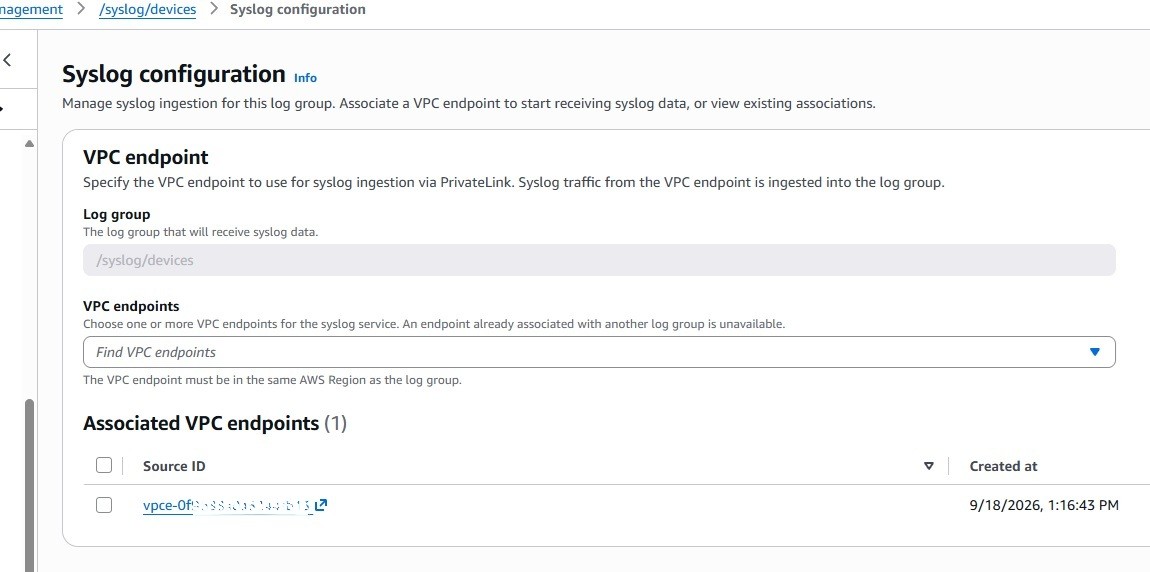
Associating the VPC endpoint with the log group — the step that turns traffic into ingestion.
The step that is easy to miss is the resource policy. The syslog service writes to your log group as the syslog.logs.amazonaws.com service principal, and until a resource policy grants it logs:PutLogEvents and logs:CreateLogStream, the traffic is rejected. Scope it with aws:SourceArn set to your endpoint ARN — and aws:SourceAccount for good measure — so only that endpoint can write to the group. AWS provides a template in the setup guide.
You do not create a log stream yourself. The service creates one per endpoint automatically, named <vpce-id>_Syslog_<region>, on the first message.
What the parser gives you
RFC 5424 and RFC 3164 are detected and parsed automatically; Cisco FTD/ASA is a third supported format. For RFC 5424 the extracted fields are:
Field | What it holds |
|---|---|
facility | Log category name (e.g. kern, auth, local0) |
facilityCode | Numeric facility code (0–23) |
severity | Severity level name (e.g. emerg, err, info) |
severityCode | Numeric severity code (0–7) |
timestamp | Message timestamp in ISO 8601 |
hostname | Source device hostname |
appName | Application name |
procId | Process ID |
msgId | Message identifier |
structuredData | RFC 5424 structured data (key-value metadata) |
message | Message body |
RFC 3164 gives a subset — no msgId or structuredData, and appName/procId are pulled from the TAG field. Cisco FTD/ASA has its own set again (device, messageId, subsystem and so on). Everything is stored in its original raw form; the fields sit alongside it for querying.
What the logs looked like
I pushed two real sources through it: production PAN-OS logs from Prisma Access and Panorama, and lab Cisco Catalyst switches.
PAN-OS came through clean. It sends RFC 5424, so the envelope was parsed with no work on my side — @data_source_type read rfc5424, and facility, severity, hostname, appName and msgId were all populated.
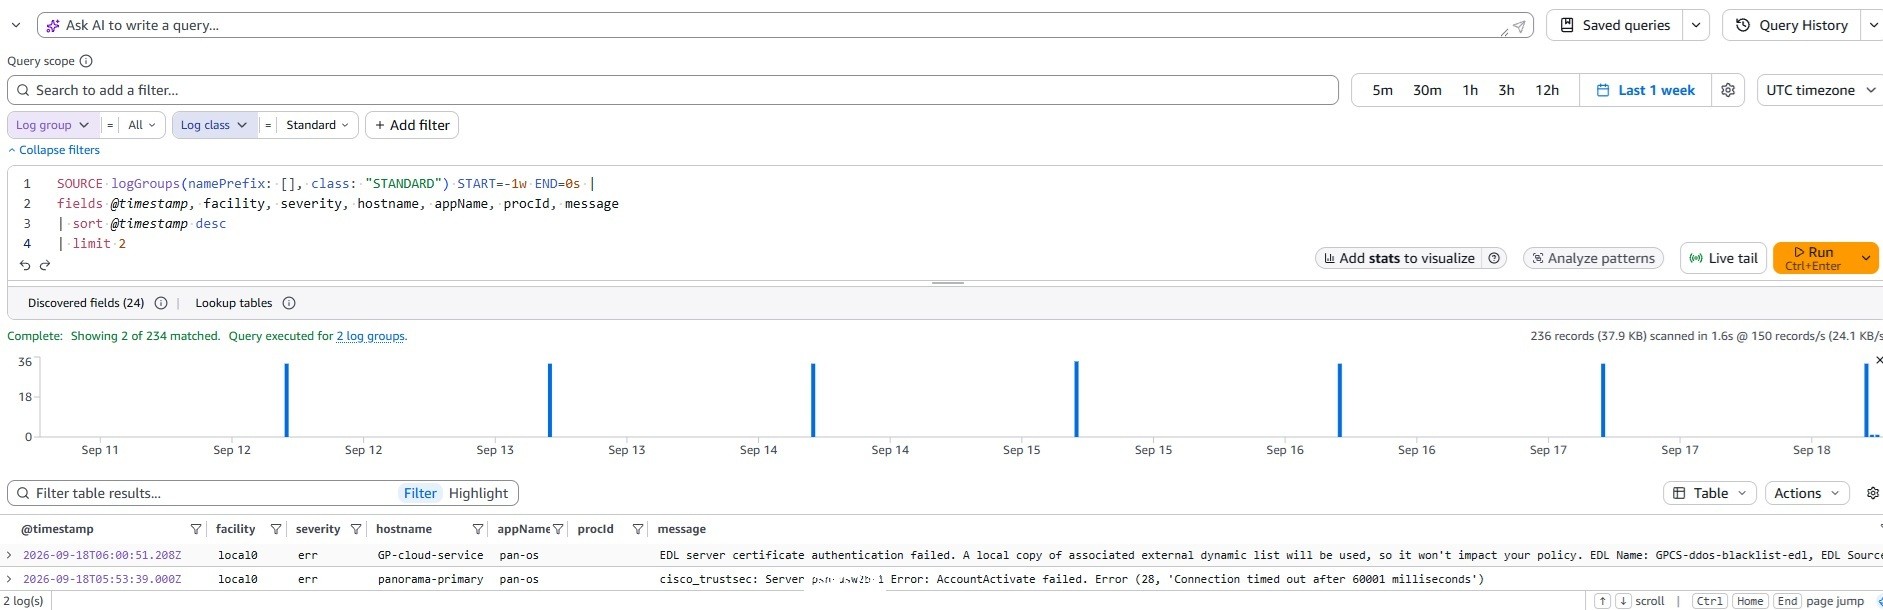
Two PAN-OS messages in Logs Analytics with the syslog envelope broken into fields.
A Prisma Access message about an external dynamic list certificate check arrived with its full body intact and searchable, and so did a Panorama error about a TrustSec account-activation timeout.
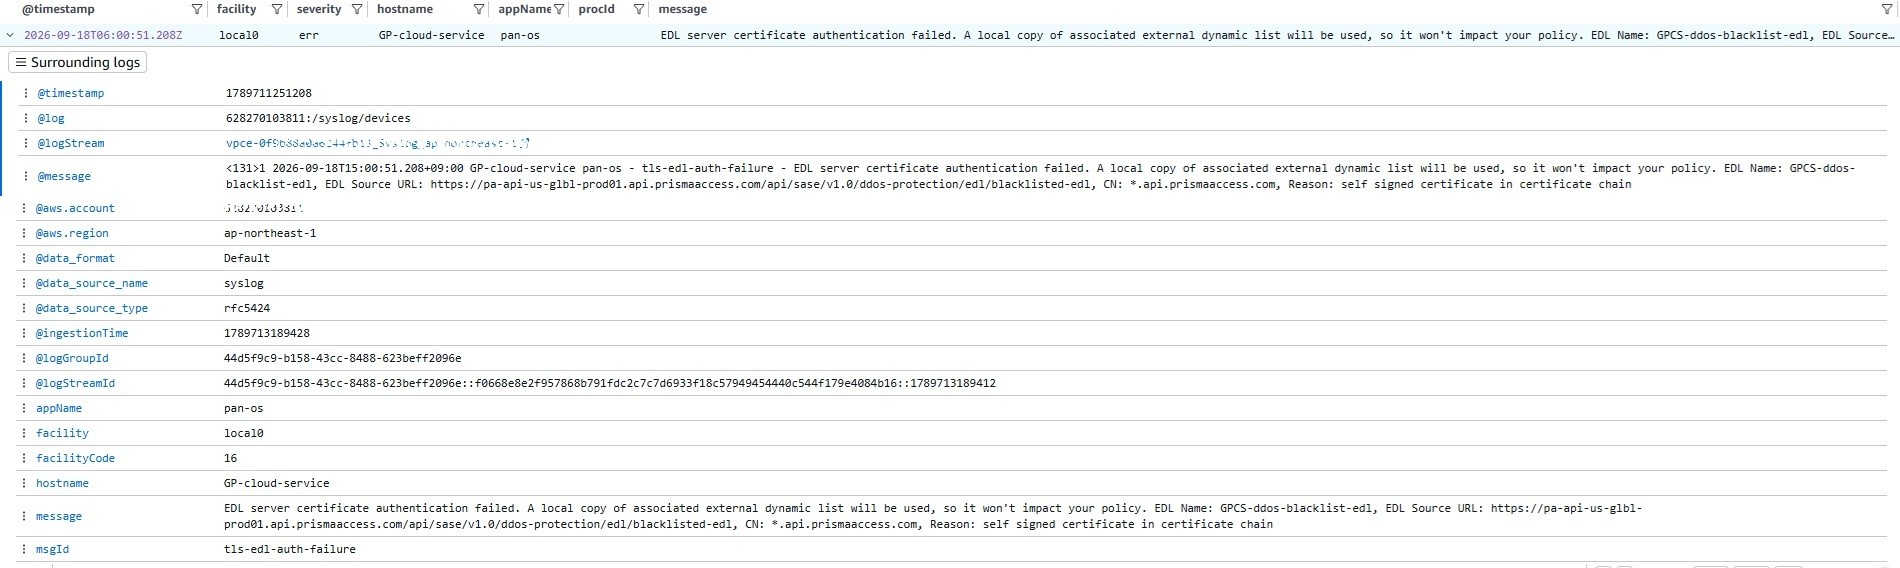
A Prisma Access EDL certificate message, expanded — every extracted field alongside the raw line.
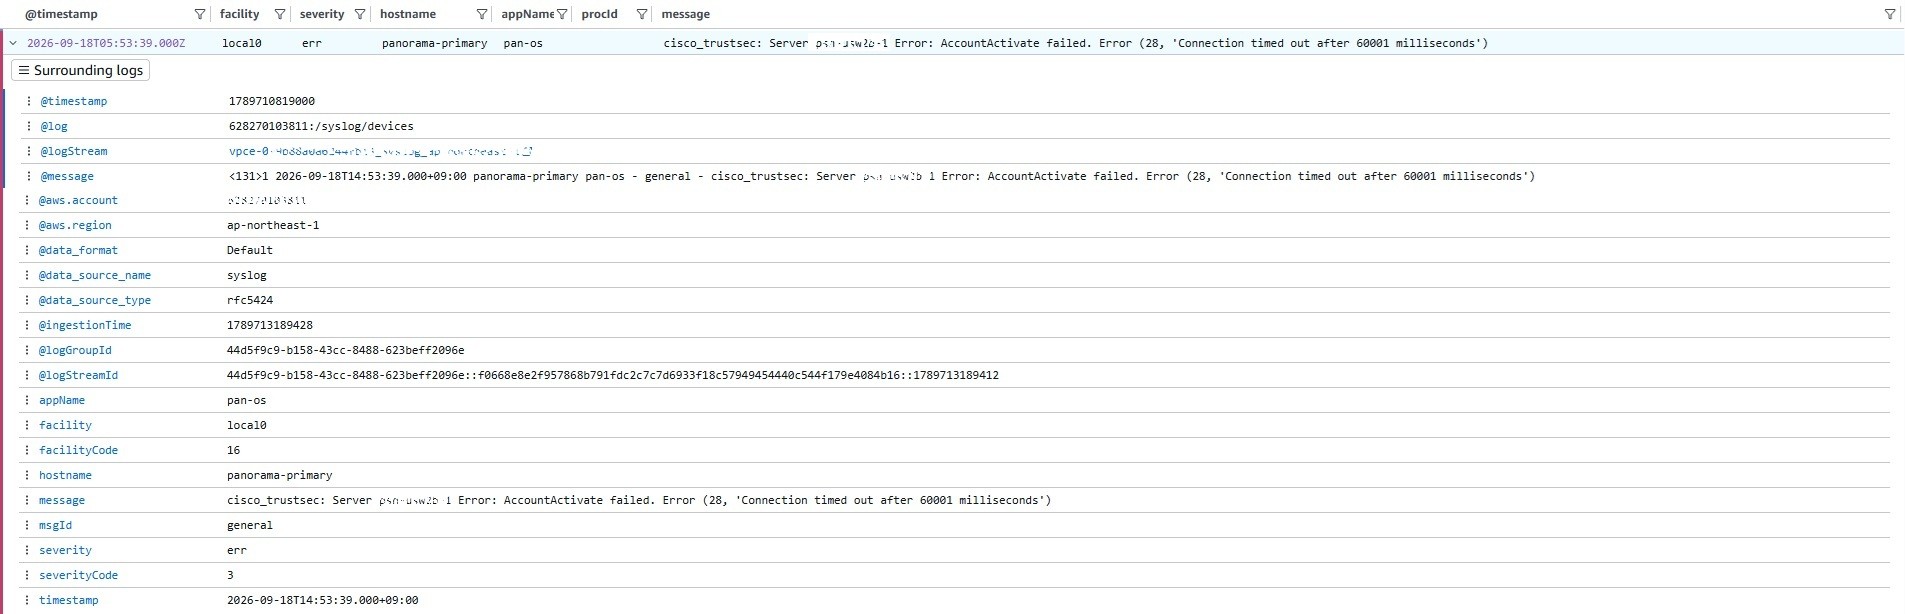
A Panorama TrustSec timeout error, expanded, parsed as RFC 5424.
Cisco Catalyst was the more instructive case. IOS-XE sends RFC 3164, so the standard fields — timestamp, host, facility, severity — were extracted automatically. But the part you usually want from a switch, the %FACILITY-SEVERITY-MNEMONIC tag, lives in the message body, and the managed parser leaves it there: automatic Cisco parsing is scoped to FTD and ASA, not Catalyst IOS. Pulling the mnemonic out is a single parse expression in Logs Analytics.
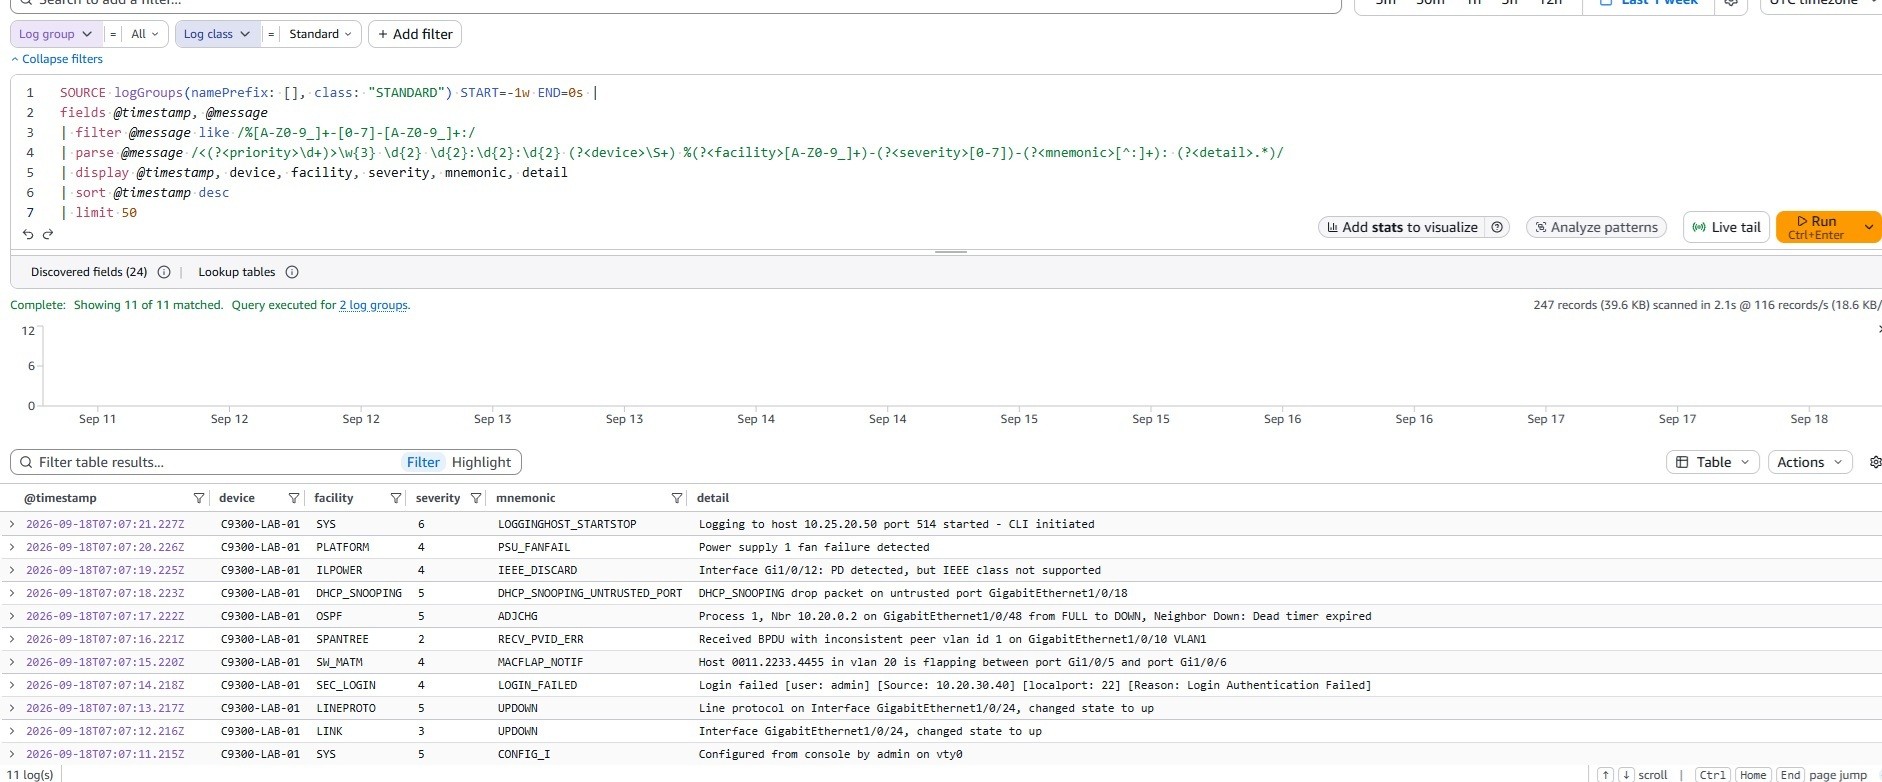
Catalyst IOS logs with the %FACILITY-SEVERITY-MNEMONIC tag extracted by a parse expression in the query.
That is less a limitation than a thing to know: the managed parser handles the syslog envelope for you; anything vendor-specific inside the body, you extract in the query. Latency was not an issue — messages appeared in the log group within seconds of being sent. AWS documents a typical 10 to 20 seconds.
Searching the messages
With the fields in place, Logs Analytics treats the message body like any other field. A plain search for Error across both log groups returns matching lines regardless of vendor, which is the everyday case for a NOC or SOC chasing a symptom.
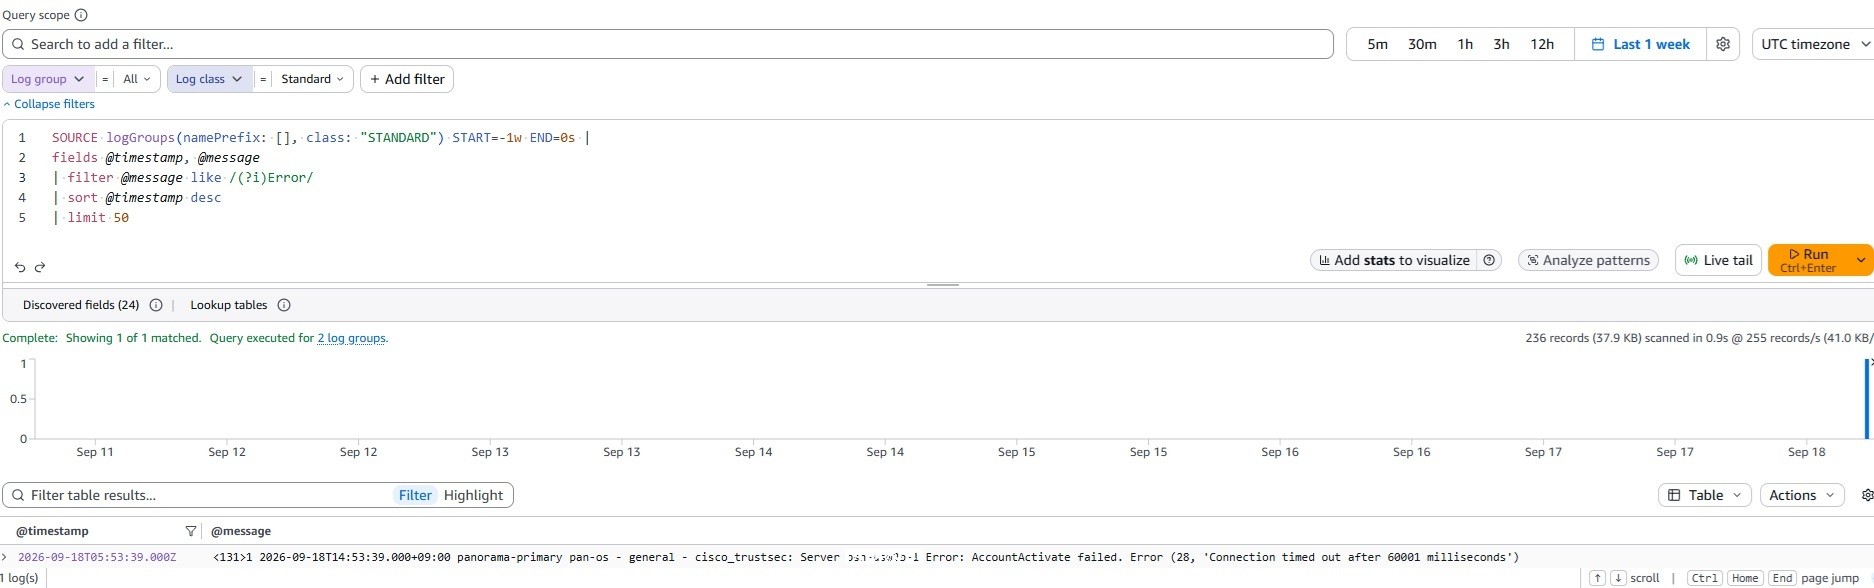
A body search for Error across both log groups, matching PAN-OS and Cisco alike.
For anything you will run more than once, save the query rather than retyping the regex.
What to know before you lean on it
Ports are fixed. 6514, 1514 and 514, with no customisation. If your standard is a non-default syslog port, this will not meet it.
There is no per-message acknowledgement. Syslog never had one. Over TCP the service signals failure by resetting the connection — an exceeded quota, a missing log group or a denying resource policy all surface as a reset, which at least gives your client backpressure to buffer locally. Over UDP, dropped is dropped, silently. Watch the
SyslogMessagesDroppedmetric; itsReasondimension tells you why.The throughput ceiling is shared. It is your account's
PutLogEventsquota — 5,000 requests per second per Region by default — not a syslog-only budget, so a noisy onboarding competes with other log producers in the account. Raise it through Service Quotas if you need to.Body parsing stops at the envelope for anything other than FTD/ASA, as above.
When it is a good fit
You already have an AWS footprint and on-premise connectivity over Direct Connect or VPN. The endpoint is just another private destination for traffic you already route.
You want centralisation without owning the collector. Nothing to size, patch or make highly available.
Your estate is small-to-medium and your ports fit 6514/1514/514.
It is a weaker fit if you need custom ports, delivery guarantees the protocol cannot give, or a SIEM's correlation and retention model. CloudWatch Logs is a log store with a capable query language, not a SIEM.
In short
Managed syslog ingestion does what it says: agentless syslog into CloudWatch over PrivateLink, a four-part setup, and automatic parsing of the syslog envelope. For an AWS-resident team that wants shared log visibility for a NOC or SOC without running a syslog server, it is a sensible, low-commitment option. You trade port-level control and body-level parsing for having nothing to operate — for many estates, that is the right trade.
Frequently asked questions
Does it need an agent?
No. Sources send syslog straight to a VPC endpoint; nothing is installed on the device and no collector sits in the path.
Which ports and protocols are supported?
TCP with TLS on 6514, plain TCP on 1514, and UDP on 514. The ports are fixed and cannot be changed.
Which syslog formats are parsed automatically?
RFC 5424, RFC 3164 and Cisco FTD/ASA are detected and parsed. Other vendor formats arrive as raw syslog with the standard envelope fields extracted; anything vendor-specific in the body you parse yourself in a query.
How quickly do logs appear?
In my test, within seconds of being sent. AWS documents a typical 10 to 20 seconds.
What is the throughput limit?
Syslog shares your account's PutLogEvents quota — 5,000 requests per second per Region by default — which is adjustable through Service Quotas.
Is this a SIEM?
No. It is managed ingestion into CloudWatch Logs. You get storage and Logs Analytics queries, not SIEM correlation, alerting workflows or case management.
Pavel Kucera is an independent security consultant specialising in OT, ICS and IoT environments. He runs fixed-scope firewall, security, device-security and architecture reviews, remotely, for teams that need a second set of eyes on critical infrastructure.
Sources
All vendor references verified 21 September 2026.
Setting up syslog ingestion — Amazon CloudWatch Logs User Guide — AWS
Configuring syslog devices — Amazon CloudWatch Logs User Guide — AWS
VPC endpoint policies for syslog — Amazon CloudWatch Logs User Guide — AWS
Troubleshooting syslog ingestion — Amazon CloudWatch Logs User Guide — AWS
Amazon CloudWatch Logs supports managed syslog ingestion — AWS What's New — AWS, June 2026